
Arnaud Borrens
DATA ANALYST
Excel | SQL | Python | TableauI love distilling insights from data to crystalize data-driven decisions.
PYTHON
Real-Estate
Search Optimization
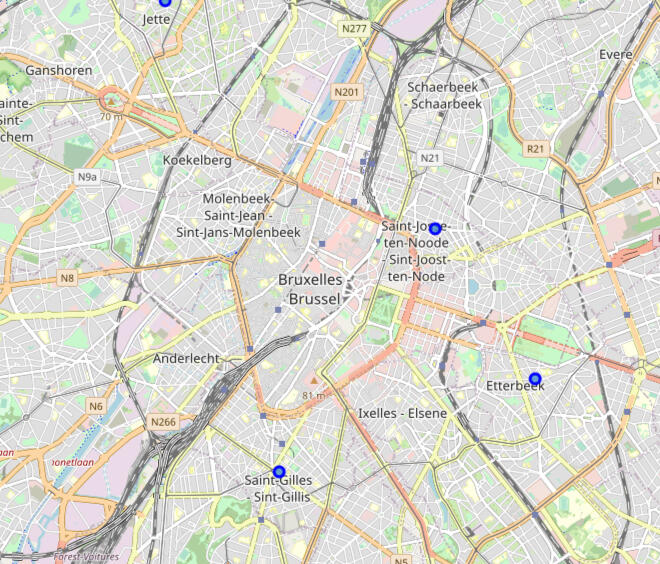
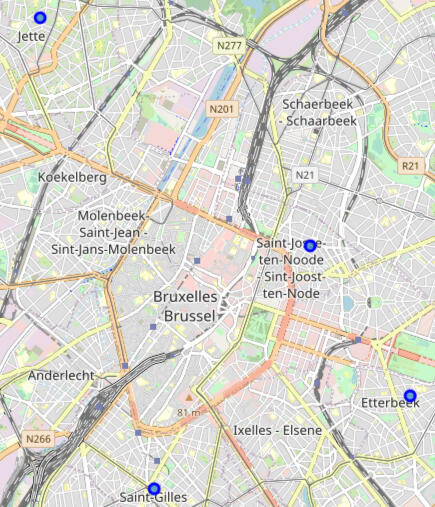
Analyzing the best neighborhoods to live in based on a set of criteria using web-scrapping, API calls, and geo-visualization.
Excel
Crypto Wallet
Dashboard
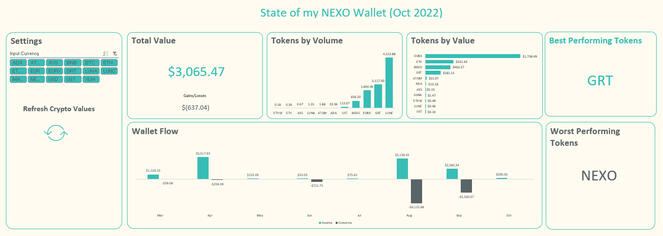
Visualizing my crypto wallets' performance using Excel and CoinMarketCap's API .
Tableau
World Government Summit 2023
Visualizing health data for the World Data-Visualization Prize organized by information is beautiful and the World Government Summit.

Python | Real-Estate Analysis
Executive Summary
In this project, I help a young couple pinpoint the 4 best neighborhoods to find a new apartment based on their hobbies.Skills used:
-Pandas
-Data Visualization using the Folium package
-Web scraping using Pandas integrated read_html method
-API calling using Foursquare API
To learn more about the project head over to GitHub and check it out:
Excel | Crypto Wallet Performance
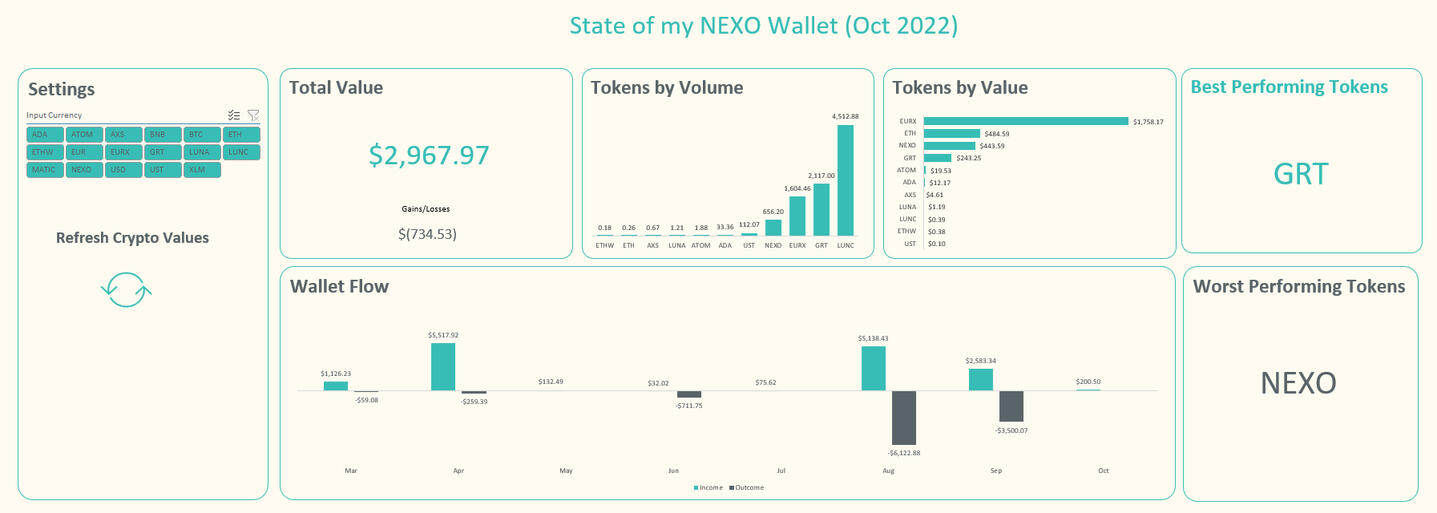
Being a web3 and crypto enthusiast I started using Nexo in March 2022 as they offered interesting interest rates and features and an easy entry point for buying cryptocurrencies. But since then, and all the things that happened in the crypto space, I wanted to understand better how my 'crypto position' was doing.
Not finding a clear image in the Nexo app, I went ahead and created my own Dashboard in Excel. Essentially, I wanted to know what my current locked total value was, what my potential gain or loss was, what coins and how many were in my wallet, and what coin had the best performance and what coin had the worst.
Insights
With only one click the values of all my coins are updated and the graphs refreshed thanks to CoinMarketCap API's!
The worst-performing coin is actually the NEXO coin as it decreased from around 2€ to 0.70€.
The best-performing coin in my wallet is GRT as I actually won a giveaway competition and the coin increased in value.
In total, however, I lost around 700€¹ mainly due to the crash of the crypto sphere, with LUNA and UST dropping to nearly zero and the NEXO coin halving its value. Nevertheless, I remain hopeful!Skills used:
-CoinMarketCap API
-Pivot Tables
-Slicers
-Dynamic Arrays
-Macro¹values taken on May 9 2023.
Tableau | World Government Summit 2023

For the data visualization challenge organized by information is beautiful in partnership with the World Government Summit 2023 I decided to analyze the occurrences of Dementia over a 10-year range. To do this I used the datasets provided as well as some additional data I researched.
Insights
It turns out that Dementia is far higher in economically developed continents such as North America and Europe, which begs the question if it's due to better access to healthcare and therefore more diagnosis or if other continents simply don't diagnose Dementia.
Moreover, when comparing Health Expenditure per capita and Dementia incidence we can see that, counterintuitively, the more health expenditure the higher the Dementia incidence.Skills used:
-Tableau
-Unpivot
-Web-scrapping
To check out the project further head over to my Tableau Public profile and check it out: